Operations
Problem statement
In order for a covid aggregator website/API to work, following are the steps that need to be followed:
- Track state bulletins on a daily basis.
- Convert the different state bulletins into a standardised format.
- Make these entries into a data store (a database/file store et al).
- Website/API needs to pull data from this store.
We follow the below steps to achieve the above mentioned requirements:
- We track all state bulletins using a telegram bot that tracks twitter/website updates for each state and posts in a telegram channel. This is used by volunteers when they want to update data.
- The cases format for each district is standardised as delta numbers for that day per category (Confirmed/Recovered/Deceased/Migrated).
- Our data store is based out of Google Sheets that sync to a Github repository using Github Actions.
- The Github repository is what acts like our API endpoint and a place from which our website pulls the data.
Most of this is documented here.
While this method is cost effective (zero cost since everything we use is a free platform), there are much simpler ways of doing this. Please consider using the sources of data we have and building your own tracker using these sources. All that is needed is a data store and a website to expose the data.
Detailed Explanation
Sources for states
Please refer this link for all the sources we use for data. This contains the list of sources per state and also sources we track for vaccination (cowin API).
Inputting data points
Data operations team is responsible for updating the data onto the Google sheets which in turn acts as the entry point for all the data we expose. Different datasets have different sheets associated with it. This document is one of our versions that has multiple sheets corresponding to different datasets.
The standard format for the cases sheet is shown below:
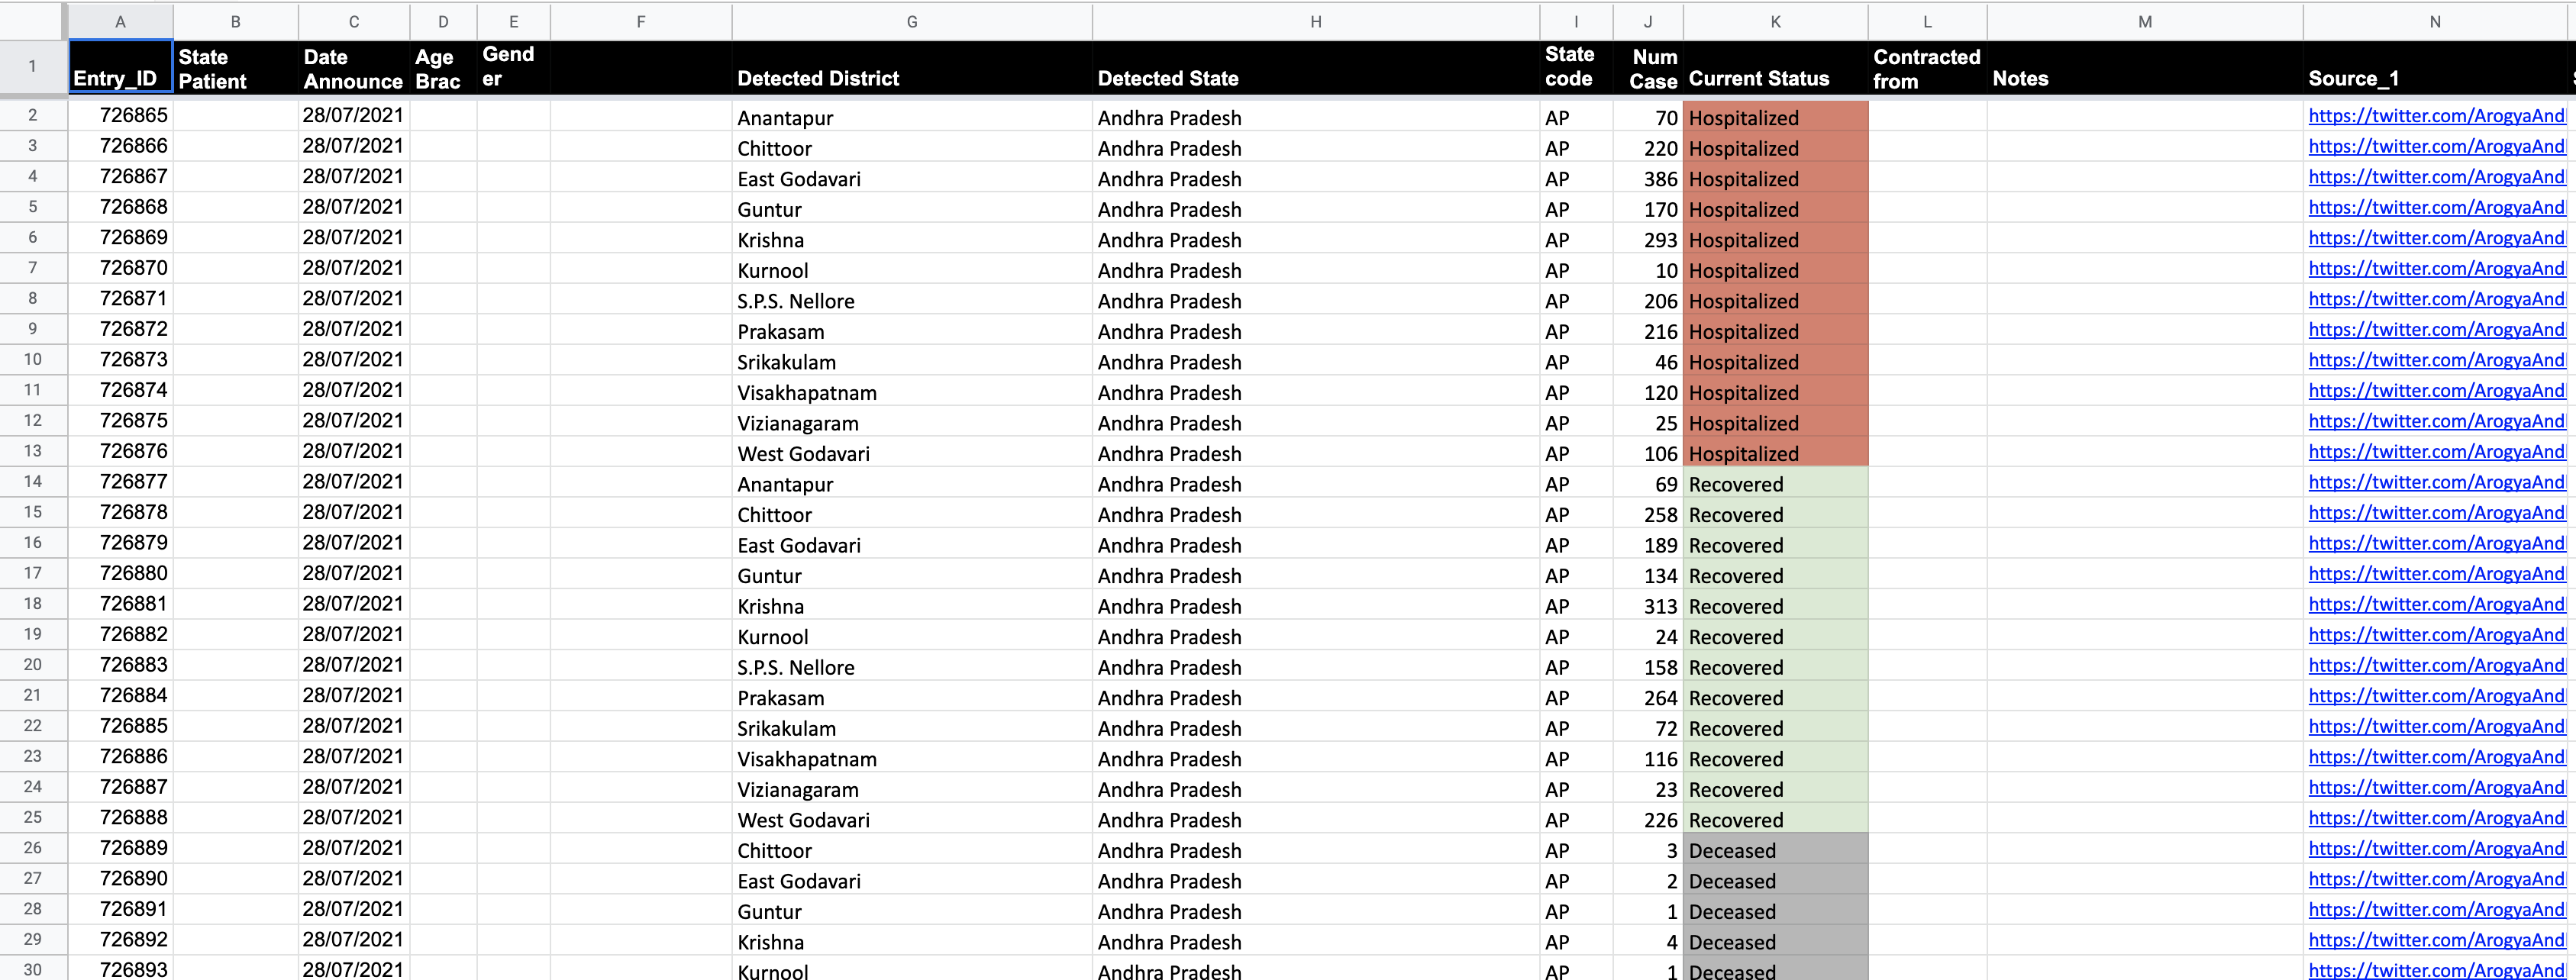
- Data is always added in delta increments. i.e, the current day’s numbers for confirmed, recovered, deceased and migrated is added as one row per district in the cases sheet.
- To calculate the delta for a given day, we use the following logic:
(cumulative numbers for a category for a district in today's bulletin - cumulative numbers for a category for the district taken from covid19india.org website) - For vaccine and testing data, the data is pulled from the sources (bulletins, cowin API) and is directly entered to a different Google sheet. There’s no other calculation required for it.
Converting bulletins to standardised format
Most of the states have a pretty regular bulletin that they share on their twitter handles/websites. These come as pictures/pdfs or dashboards. We use the following ways to convert these to standardised bulletins:
- Pictures - we use a mix of opencv + google vision api to extract the text from images.
- Pdfs - camelot and pdftotext is what we use to read pdfs and convert them
- Dashboards - we use beautifulsoup to read a dashboards. Some of the dashboards have api endpoints that we use directly (example cowin api).
These are used in conjuncture with the covid19india.org endpoints to get the delta values for a given day. Most of these are added as a part of a telegram bot automation so as to allow volunteers to get these values to be added on Google Sheets. A detailed technical explanation is given here.
Sheets used
Below are some of the major sheets used and how they relate to the overall structure of data:
- Raw_data: This is a sheet that has the basic district level Confirmed, Recovered, Deceased and Migrated delta per day details. This is versioned after around 20k rows to prevent it from becoming very slow.
- Statewise: This is a sheet that is an aggregated value per state. This is pulled from raw_data sheet using formulae.
- Districtwise: This is a sheet that has district level aggregates (cumulative and delta).
- Auxillary_data_statewise: This sheet contains the testing numbers per state as given by state bulletins.
- Tested_Numbers_ICMR_Data: This contains testing numbers as given by ICMR bulletin at India level (no state splits).
- Statewise_vaccination_Cowin: This contains statewise vaccination numbers pulled from Cowin api.
- Districtwise_vaccination: This contains districtwise vaccination numbers pulled from Cowin api.
- New_MOHFW_Sheet: This contains per state per day vaccination and testing details as put out by MOHFW bulletin.
- Statewise/districtwise_Previous_Partition: These sheets allow us to keep a track of the values when the new version of raw sheet was created. More of this is documented here.
Data sync
- The data from the Google Sheets is directly pulled to a csv file.
- These files in turn are consumed by a json parser that gives us the data in a format that we need for the website.
- Some of the sheets are directly synced and kept as csv files. These are directly exposed as csv endpoints.
A bit about the bots
We use Telegram bots for some of our work. These run out of Github actions. Listed below are a couple of heavily used bots:
- Monitor bot - This telegram bot is used to monitor the state sources and provide udpates as and when the sources get updated. This could be a tweet from a twitter handle we are tracking, a webpage that gives bulletins or a dashboard that shows data. The data from the bot is posted on a Telegram channel where volunteers look through when they need to update some data onto the sheets.
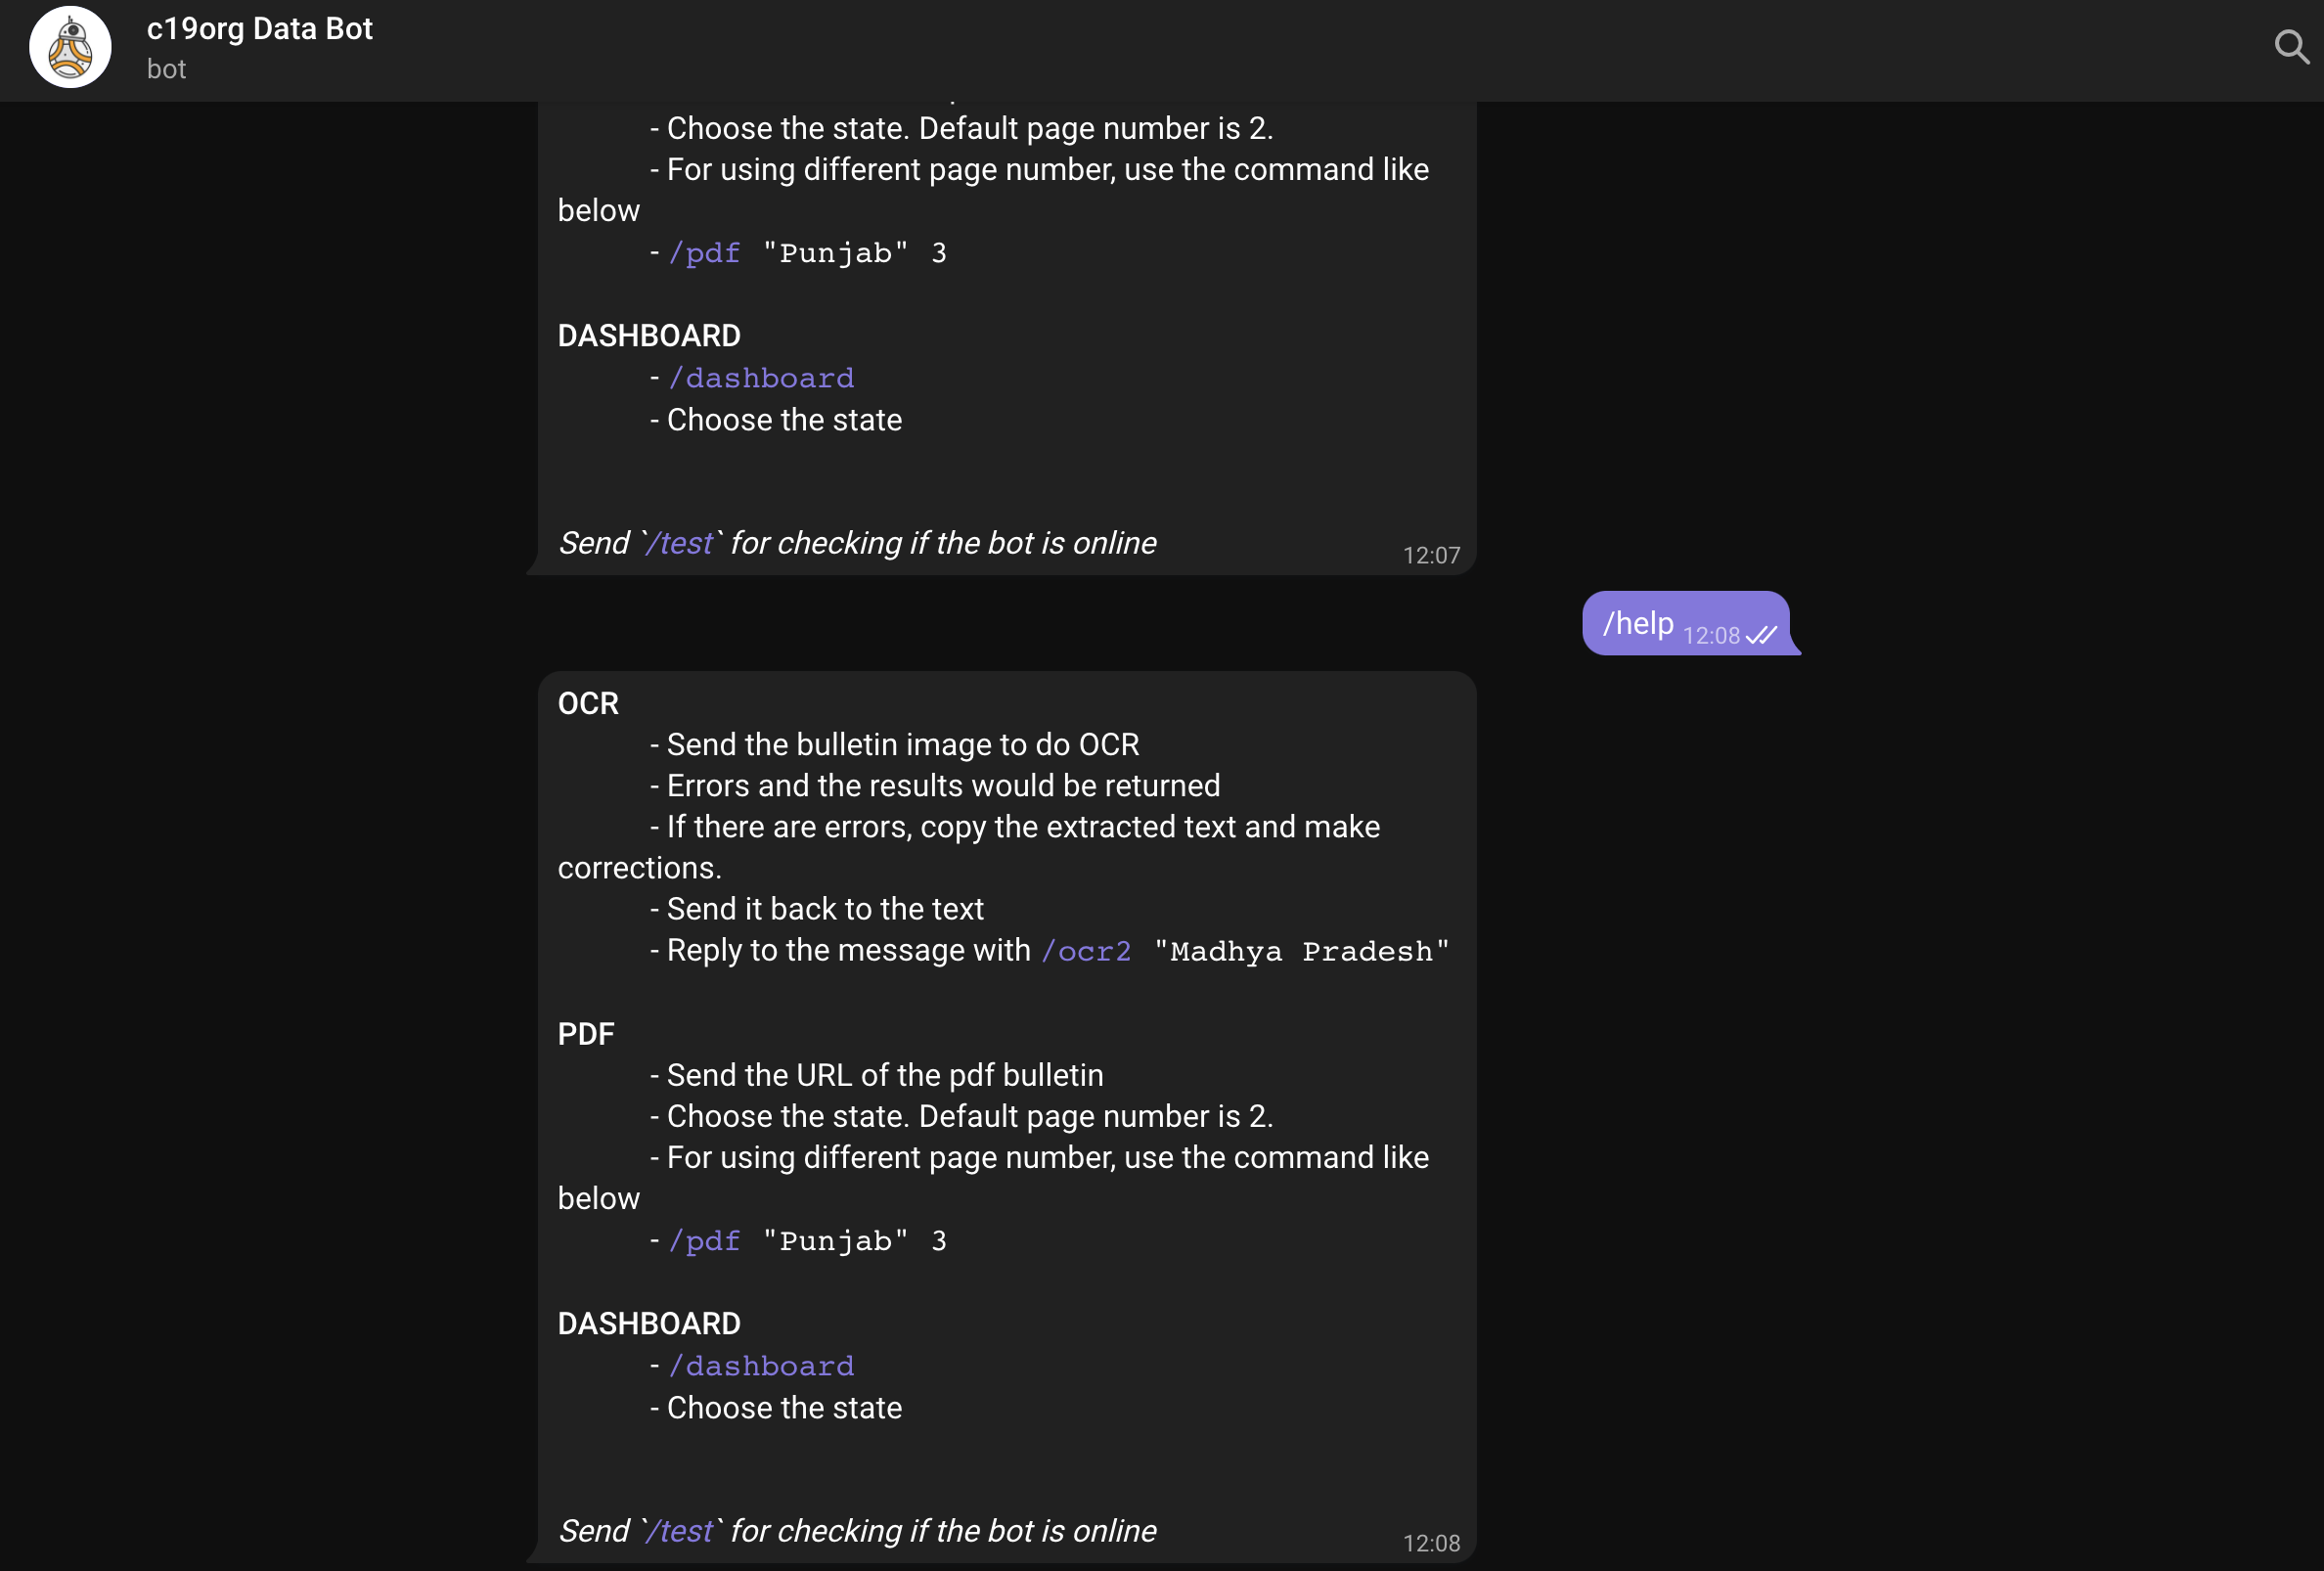
- Automation bot - This bot is used for converting bulletins into the standardised format we use. This bot has options to read images/urls. The below screenshots provide a few examples of how the bot works. More about the code can be found here.
Bot menu
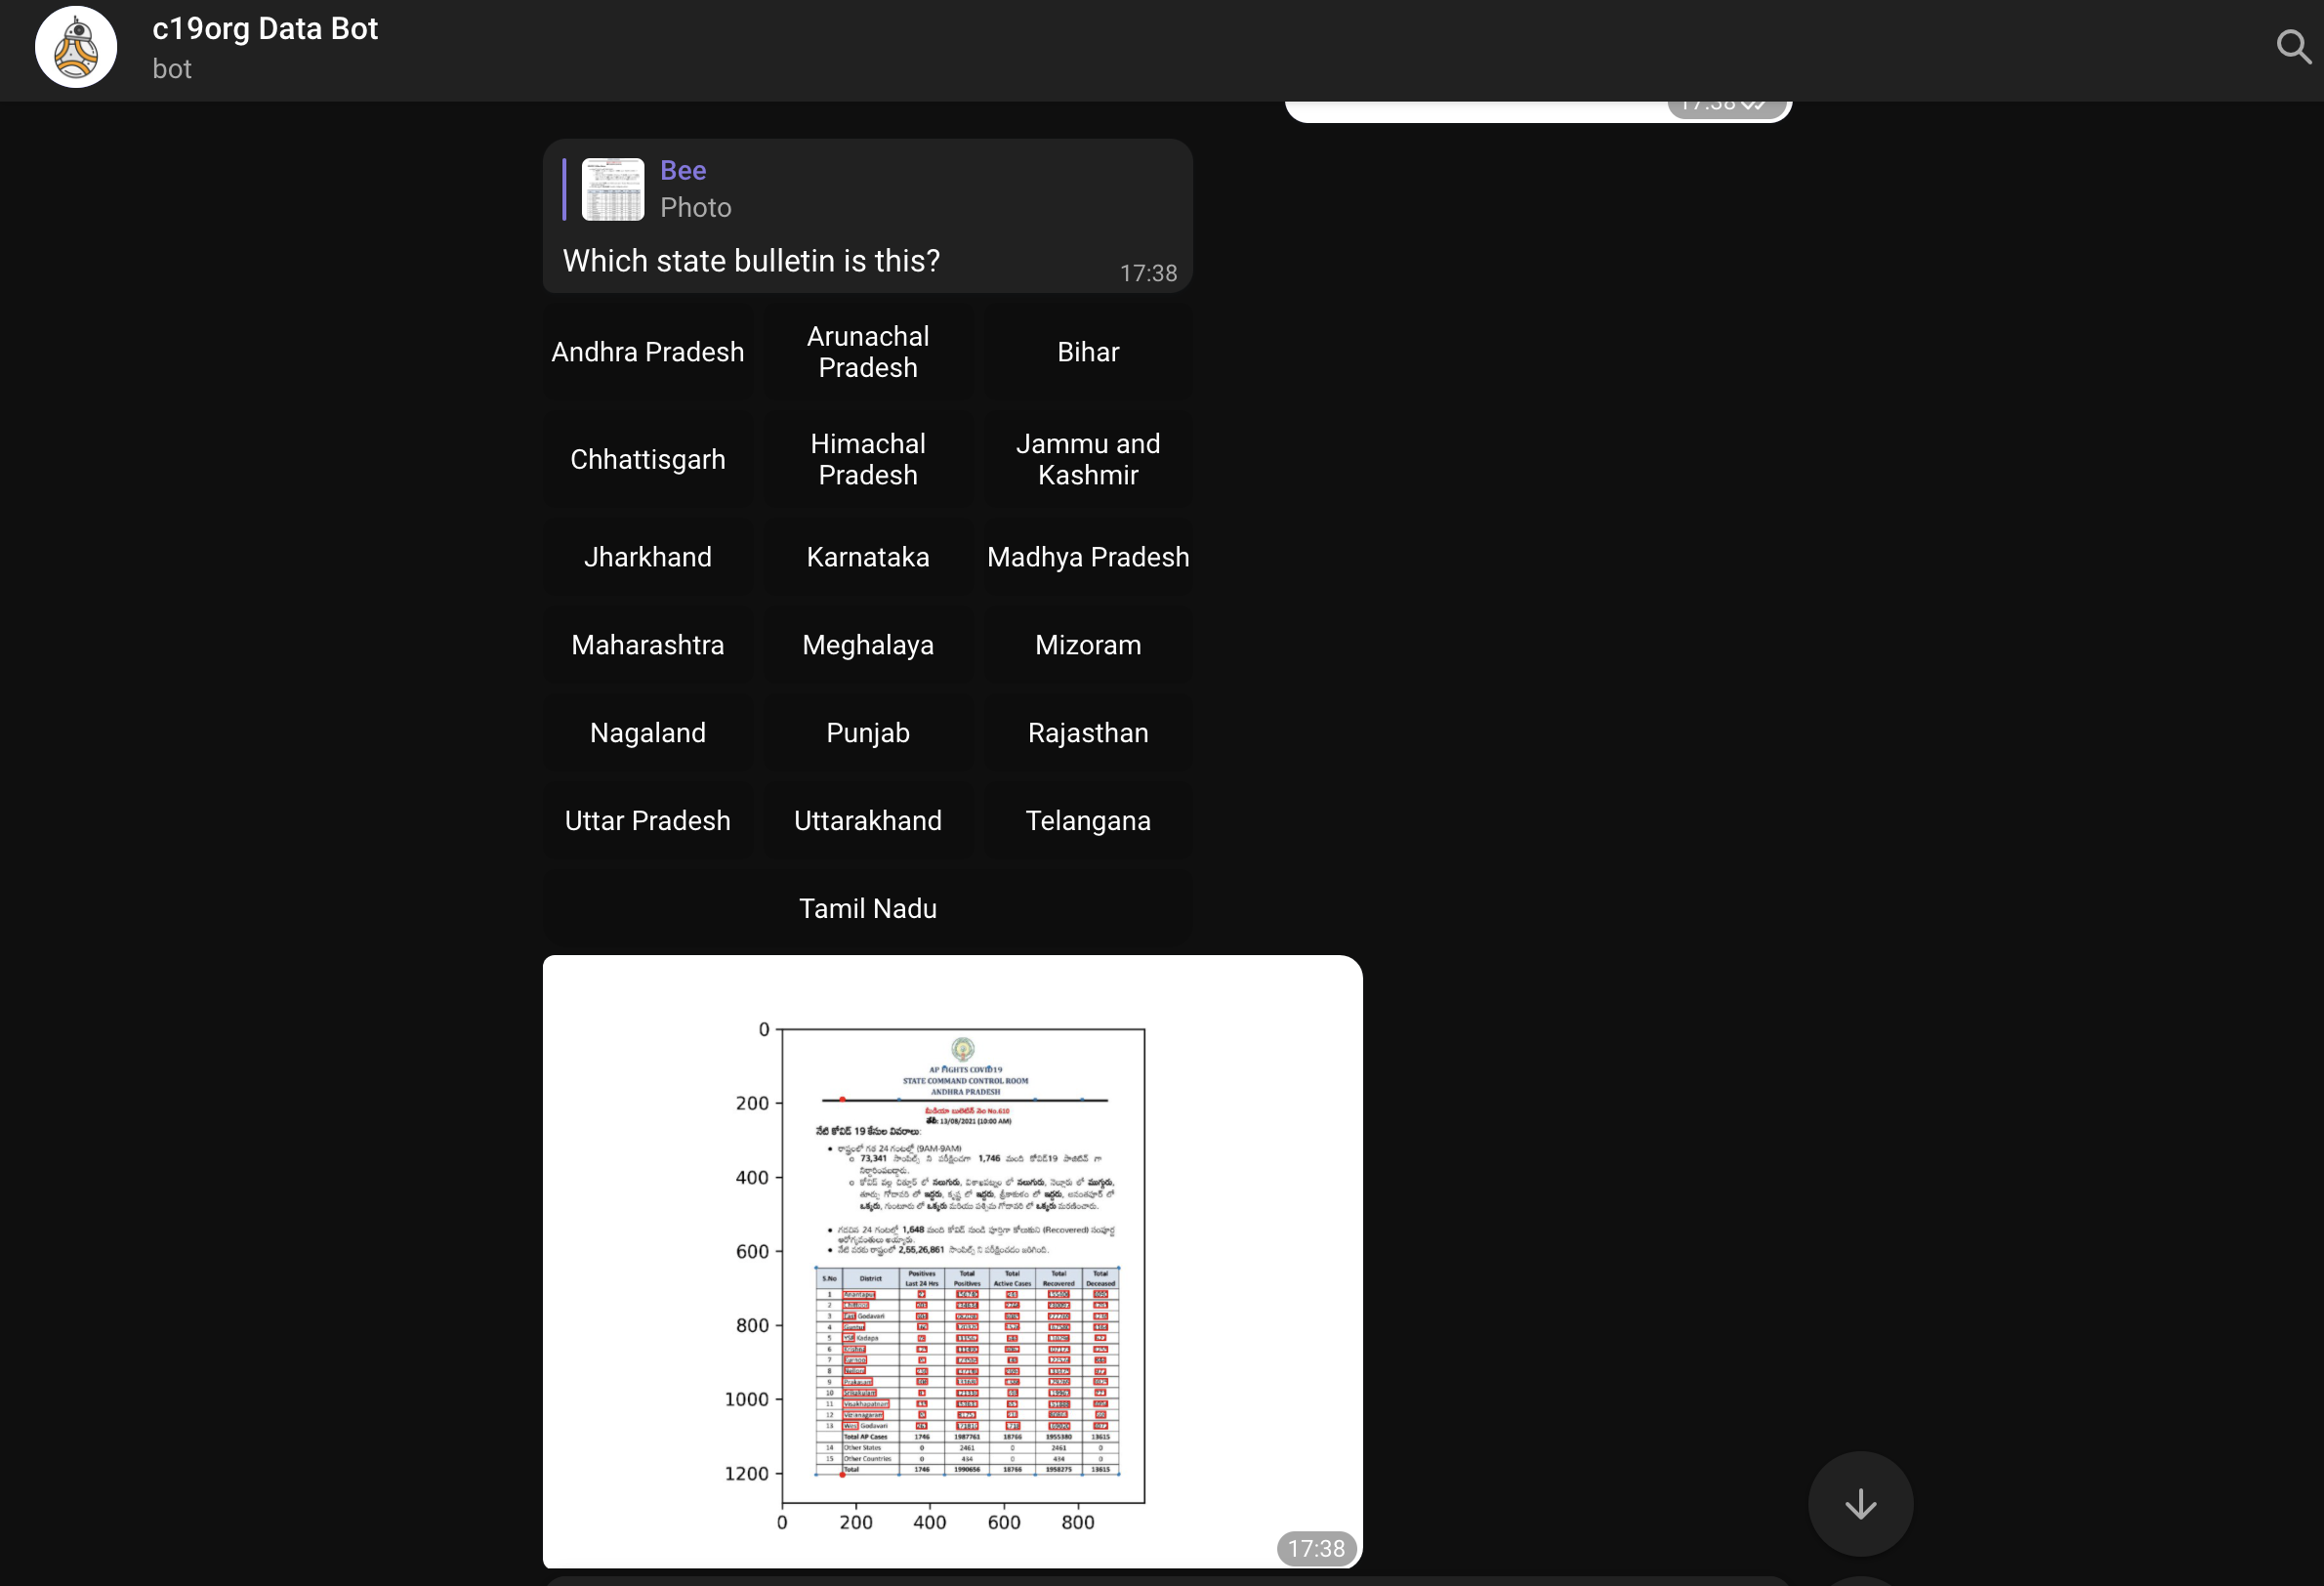
Bot reading an image and parsing it (in this case Andhra Pradesh):
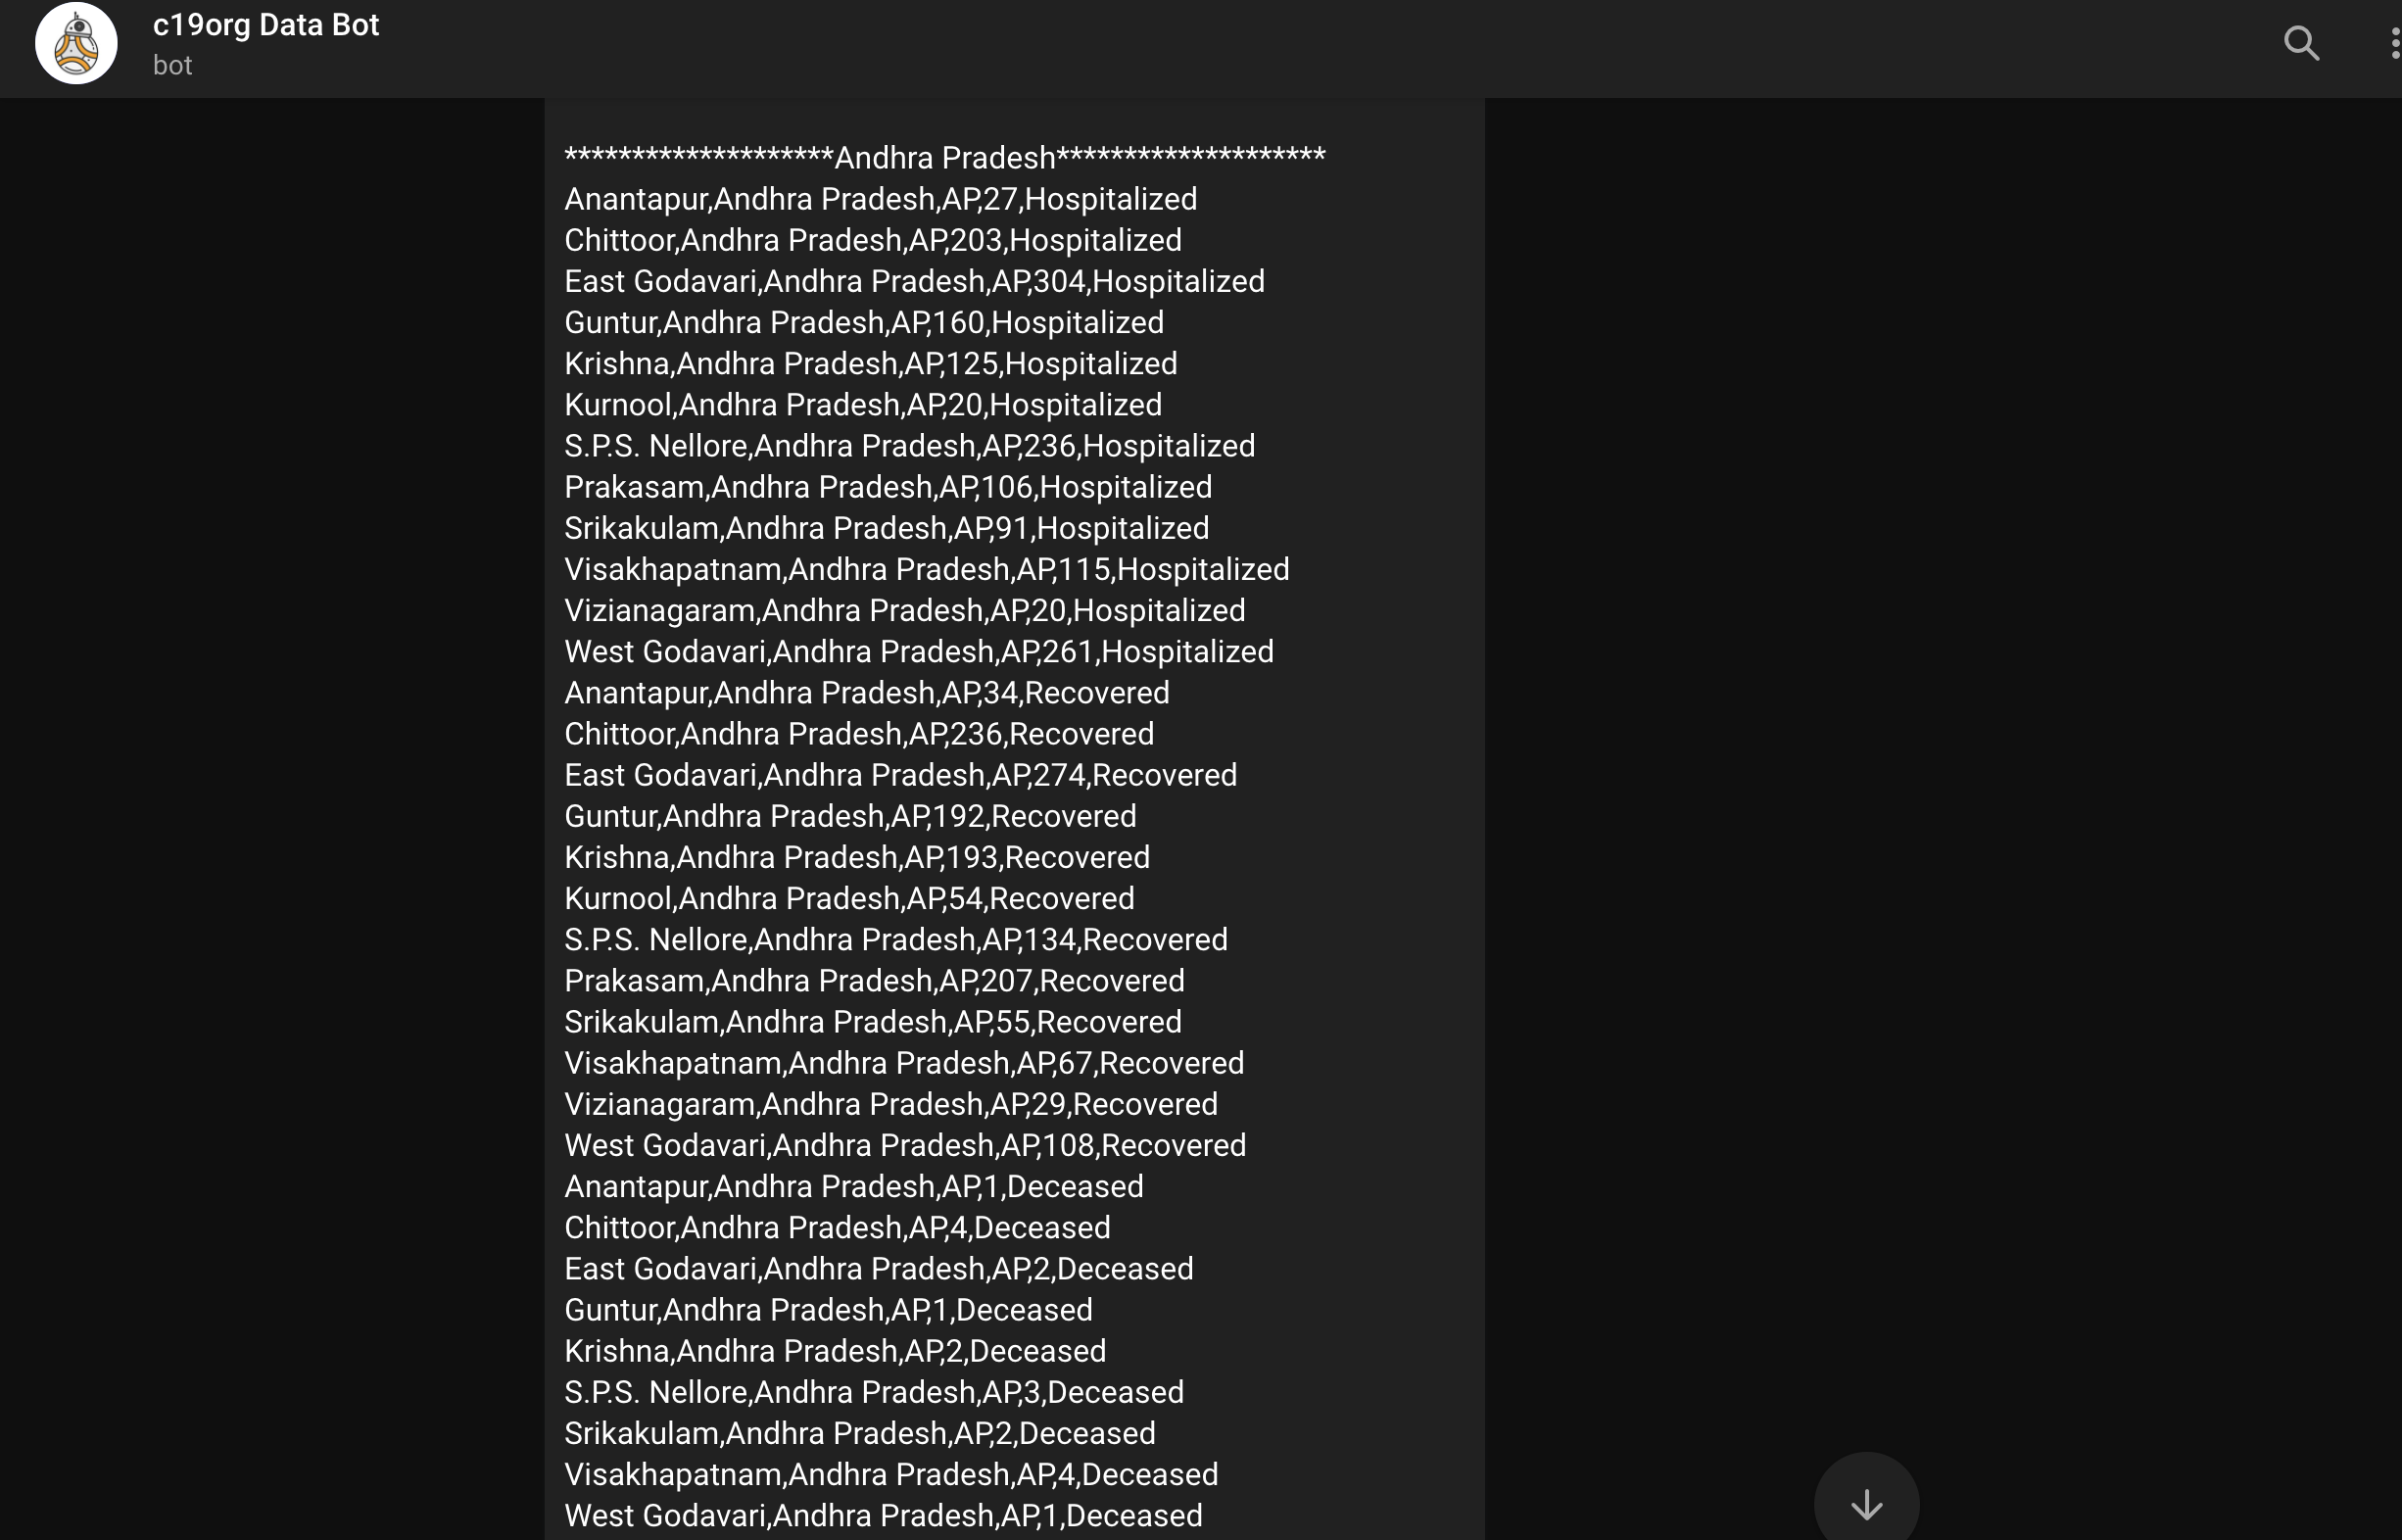
Bot output after it parses the image (in this case Andhra Pradesh):
Alternative solutions
- Data store - the reason to use Google Sheets + Github Repository was to allow anyone with/without technical knowledge to be able to enter into a sheet. Github allowed us to reduce overhead of maintaining a server that hosted a database. Alternative to this can be a traditional database with a frontend form. This reduces the overall orechestration required between google sheets and repository. Also, the data isn’t huge enough to cause maintanence issues for a database.
- Frontend - as of now, the site is hosted on Github Pages. These are static pages that are served by Github servers free of cost. Alternative to this is to host your own webserver. This allows for you to have a proper GET/POST request/response cycle allowing for a better user experience (things like optimisations in terms of data fetch, feedback et al can be implemented using this approach). The downside to a webserver would be scaling up for larger number of hits.
- Bulletin conversions - these are tricky. PDF conversions are much easier than image conversions. The Telegram Bot we have today can be used as a template. However, we strongly encourage you to see if there are parallel technologies that could solve this problem.
- Data formats - Although we followed a delta format for district entries, it is not mandated to have the same if you are building your own website. The formats we’ve adopted have evolved over time to cater to the needs we have on the frontend.
Please note that the problem is that of data aggregation. The solution we built was built around a community of volunteers coming together to make things work. We were very mindful of relying only on free to use platforms to avoid any kind of financial/infrastructural dependencies. This need not be the template on which some of you might want to build. There are different solutions that can solve the same problem.
Also, once we cease the operations, all of our data will continue to be available under data.covid19india.org.
Fare thee well,
covid19india.org