Struggle
Our response to a reporter!
1. When did the idea surface? Was there a trigger?
March 12th 2020, a few of us were discussing how India doesn’t have a single source of information and maybe we can do something about it.
We bought the domain covid19india.org, created a Google Sheet and manually entered the data with the source. The original dashboard was very primitive, a single page with a map and a table with just the state data. We were following an open source covid tracker made to track cases in Japan covid19japan.com and was inspired by them.
2. How much time and how many people did it take to put the API and site together?
The initial idea was to keep the Sheet public with edit access to few and view access to everyone. The website pulled the data directly from the sheet. And anyone could verify the source of the data. But within a week we had too many visitors and the traffic on Google Sheets was not letting us edit or fetch data from the sheet. One of the developers did some ‘jugaad’ to keep the data along with the code so that we can serve the site directly from Github without any server costs. Hence the api repository was born (https://github.com/covid19india/api/). We made the Sheet private, but kept the api repository in sync with the data in Google sheet using github actions. Every 10 minutes there is a script running on github actions to fetch data from the sheets and dump in the github repository. https://github.com/covid19india/api/actions
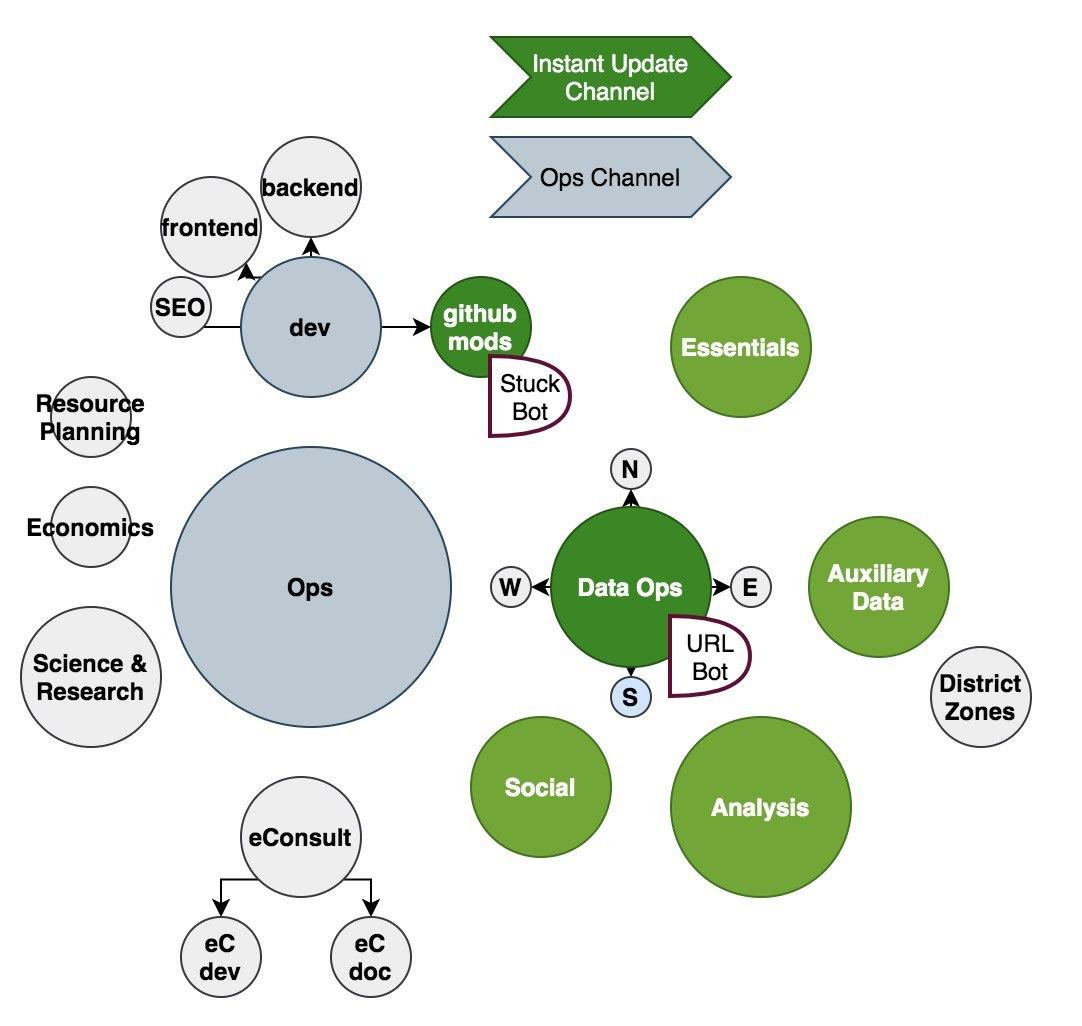
First 5-10 volunteers joined our Ops group and everything was managed by them. Within a week, thousands of volunteers joined the Ops group and pitched in. Several groups were bifurcated from the Ops group to handle several functions. Right now around 25 volunteers regularly monitor press releases and official twitter handles to gather, structure and input data to the Google sheet. Large number of developers continue to contribute through Github. Number of contributors stands at 97 at the moment.
Apart from these there are 3 bots that monitor sources and automate some of the processes.
3. How are server costs met? Have operational costs risen since you started?
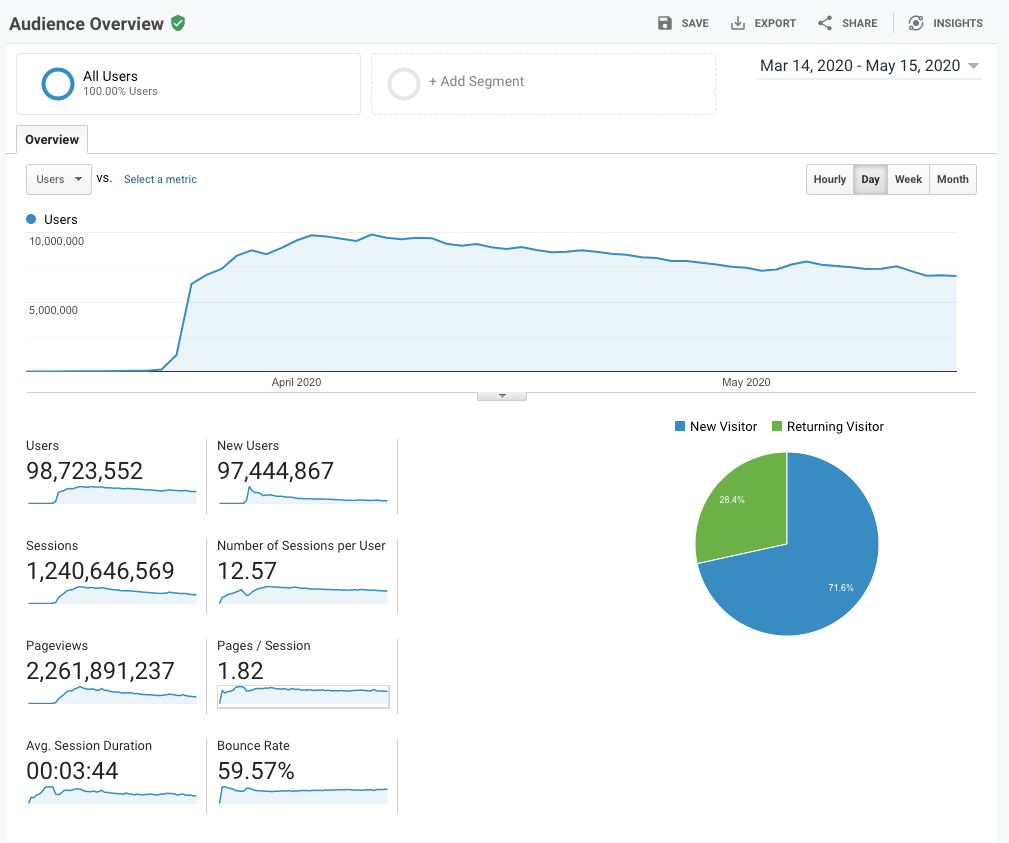
We do not have a server or a conventional database. All our data is in Google Sheets and a copy of it parsed to a machine readable and human readable format to the api repository using Github actions. Since serving static pages from GitHub is free of cost. We have served over 2B page-views in the first 2 months since inception.
The only real cost we had so far is the domain cost: Rs.965
4. Who takes care of the backend and performance?
We do not have a backend as such. Everything is served directly as github pages. The data is packed optimally so that our dashboard and other analysts can make use of the data without much preprocessing from their side.
5. It must have become exceedingly more challenging lately, with cases rising exponentially.
How do you guys deal with such pressures? Did it take a while to identify the right and reliable sources? UP, for instance, does not seem to have any?
Most of the states have dashboards or press releases. Some are through websites, some on twitter. Of late we have started to use these dashboards to capture the data using scripts. We run these scripts every few hours or whenever someone notifies us of a change in numbers. These scripts use the state dashboards and give us the district number. These numbers are then vetted by one of the data ops volunteers and the sheet entries are made. For some of the bulletins that come in the form of pics (UP, Bihar), we are using OCR to calculate the data that needs to be added to sheets. These are run only once a day to get the data since most of these bulletins are released once a day. UP specifically gives out a pic to the media over whatsapp which we do OCR on.
6. How many volunteers do you have right now? Are they from across states and from various professions? How do you zero in on your volunteers, because all the work needs specialised knowledge?
All our communications happen through Telegram groups. We have branched to numerous sub-groups. There is no special knowledge required to update data. As long as people know how to work on a sheet, they can manage.
Data ops: Most of the data updates are handled by a team of 7-8 members. Several others monitor the news and verify it. The data gathering is done by a larger pool that comprises twitter followers and volunteers on data ops.
Social media team: This team comprises people who are actively monitoring our twitter/fb handles and then answering questions, giving out information about the spread and government guidelines. This team has 7-8 active volunteers.
Analysis team: This team has a varied category of people who contribute towards analysing the data and giving insights into data that we regularly put out as tweets.
Essentials team: This team handles all data collection, sanitization, verification and development of the essentials data.
Github mods: This team has 5-6 active members who monitor Github issues and figure out which features/issues make sense and which don’t.
Dev team: On the dev side, as of writing this we have had 97 contributors in react repo(which is the dashboard) and 56 in the api repository.
7. Have any of the admins been associated with crowdsourced initiatives before?
No idea. Some might have, we have kept the organization flat and lean, without getting into personal details or associations. The only requirement for volunteers is to have a heart to help the society during this pandemic.
8. What are the challenges to crowdsourcing data on this scale? How do you address that?
Data comes from 35 different government sources. We have to collect and verify all that before updating. Also, the format for all of these bulletins and tweets are immensely diverse. Some bulletins report patient totals, some report individual patients details and some have paragraphs in vernacular language - a lot of sophistication. Bringing that data to the format we need, is a challenge. To address the same, some of the devs have written scripts to automate this process.
Generally, a website that serves millions of users daily, fails when the explosive server costs start raking up. If we had gone the conventional route of hosting the website in AWS, Azure or GCP, we would have had to include advertisements or we would have had to find sponsors or donors. By using github pages, we have zero cost and could sustain the website for the past 3 months. Another challenge is the volume of data. As mentioned, we do not have a conventional database. Since we capture district level/individual patient details for each state, the amount of data we collect makes the sheets slow and difficult to work with (this can be handled easily in traditional databases). Hence, ever so occasionally, we shift to a new sheet. As of now, we are running on the 6th partition (sheet), while the rest of the 5 have been archived. The APIs continue to function as is with data being provided for each of the partitions.
9. Could you give a basic rundown of how things function? Like, say, how would 24 hours of work on covid19india.org look?
Since most of our work happens on Telegram, we start with checking the messages sent on telegram by other volunteers about data updates. Then we continue to monitor the updates that get reported to us through either twitter handles, telegram messages or a form that we have for reporting cases. This continues through the day. A lot of work happens during the evening times when a lot of states release their bulletins and we end up updating late into the night. Most of the updates end by 11pm. Some like Assam, Tripura happen later in the night and one of the data ops volunteers will update it.
10. You’ve also branched out to listing places to get essentials. That’s a lot more work. How long do you think you all will keep doing this?
No idea :) Life is a box full of surprises.
11. Also, the UI is terrific. It would be wonderful to know who all worked on it.
There are quite a lot of devs who have worked on the dashboard. Please have a look at the github repo to know about this. (A list would be too long :))